Labelled reference lines: horizontal, vertical, and diagonal
Source:R/geom_textabline.R, R/geom_texthline.R, R/geom_textvline.R
geom_textabline.RdThese geoms add labelled reference lines to a plot, either
horizontal, vertical, or diagonal (specified by slope and intercept).
These are useful for annotating plots. They are the labelled equivalent of
the geom_vline, geom_hline and geom_abline from ggplot2.
Usage
geom_textabline(
  mapping = NULL,
  data = NULL,
  slope,
  intercept,
  stat = "identity",
  position = "identity",
  ...,
  arrow = NULL,
  lineend = "butt",
  na.rm = FALSE,
  show.legend = NA,
  inherit.aes = TRUE
)

geom_labelabline(
  mapping = NULL,
  data = NULL,
  slope,
  intercept,
  stat = "identity",
  position = "identity",
  ...,
  arrow = NULL,
  lineend = "butt",
  straight = NULL,
  label.r = unit(0.15, "lines"),
  label.padding = unit(0.25, "lines"),
  na.rm = FALSE,
  show.legend = NA,
  inherit.aes = TRUE
)

geom_texthline(
  mapping = NULL,
  data = NULL,
  yintercept,
  stat = "identity",
  position = "identity",
  ...,
  arrow = NULL,
  lineend = "butt",
  na.rm = FALSE,
  show.legend = NA,
  inherit.aes = TRUE
)

geom_labelhline(
  mapping = NULL,
  data = NULL,
  yintercept,
  stat = "identity",
  position = "identity",
  ...,
  arrow = NULL,
  lineend = "butt",
  na.rm = FALSE,
  show.legend = NA,
  inherit.aes = TRUE,
  straight = NULL,
  label.r = unit(0.15, "lines"),
  label.padding = unit(0.25, "lines")
)

geom_textvline(
  mapping = NULL,
  data = NULL,
  xintercept,
  stat = "identity",
  position = "identity",
  ...,
  arrow = NULL,
  lineend = "butt",
  na.rm = FALSE,
  show.legend = NA,
  inherit.aes = TRUE
)

geom_labelvline(
  mapping = NULL,
  data = NULL,
  xintercept,
  stat = "identity",
  position = "identity",
  ...,
  arrow = NULL,
  lineend = "butt",
  na.rm = FALSE,
  show.legend = NA,
  inherit.aes = TRUE,
  straight = NULL,
  label.r = unit(0.15, "lines"),
  label.padding = unit(0.25, "lines")
)
Arguments
- mapping
Set of aesthetic mappings created by
aes()oraes_(). If specified andinherit.aes = TRUE(the default), it is combined with the default mapping at the top level of the plot. You must supplymappingif there is no plot mapping.- data
The data to be displayed in this layer. There are three options:
If
NULL, the default, the data is inherited from the plot data as specified in the call toggplot().A
data.frame, or other object, will override the plot data. All objects will be fortified to produce a data frame. Seefortify()for which variables will be created.A
functionwill be called with a single argument, the plot data. The return value must be adata.frame, and will be used as the layer data. Afunctioncan be created from aformula(e.g.~ head(.x, 10)).- slope
The slope of the abline
- intercept
the point on the y axis at which the abline crosses it.
- stat
The statistical transformation to use on the data for this layer, as a string.
- position
Position adjustment, either as a string, or the result of a call to a position adjustment function.
- ...
Other arguments passed on to
layer. These are often aesthetics, used to set an aesthetic to a fixed value, likecolour = "red"orsize = 3. These can also be the following text-path parameters:gapA
logical(1)which ifTRUE, breaks the path into two sections with a gap on either side of the label. IfFALSE, the path is plotted as a whole. Alternatively, ifNA, the path will be broken if the string has avjustbetween 0 and 1, and not otherwise. The default for the label variant isFALSEand for the text variant isNA.uprightA
logical(1)which ifTRUE(default), inverts any text where the majority of letters would upside down along the path, to improve legibility. IfFALSE, the path decides the orientation of text.halignA
character(1)describing how multi-line text should be justified. Can either be"center"(default),"left"or"right".offsetA
unitobject of length 1 to determine the offset of the text from the path. If this isNULL(default), thevjustparameter decides the offset. If notNULL, theoffsetargument overrules thevjustsetting.parseA
logical(1)which ifTRUE, will coerce the labels into expressions, allowing for plotmath syntax to be used.straightA
logical(1)which ifTRUE, keeps the letters of a label on a straight baseline and ifFALSE(default), lets individual letters follow the curve. This might be helpful for noisy paths.paddingA
unitobject of length 1 to determine the padding between the text and the path when thegapparameter trims the path.text_smoothinga
numeric(1)value between 0 and 100 that smooths the text without affecting the line portion of the geom. The default value of0means no smoothing is applied.richA
logical(1)whether to interpret the text as html/markdown formatted rich text. Default:FALSE. See also the rich text section of the details ingeom_textpath().remove_longif TRUE, labels that are longer than their associated path will be removed.
- arrow
Arrow specification, as created by
grid::arrow().- lineend
Line end style (round, butt, square).
- na.rm
If
FALSE, the default, missing values are removed with a warning. IfTRUE, missing values are silently removed.- show.legend
logical. Should this layer be included in the legends?
NA, the default, includes if any aesthetics are mapped.FALSEnever includes, andTRUEalways includes. It can also be a named logical vector to finely select the aesthetics to display.- inherit.aes
If
FALSE, overrides the default aesthetics, rather than combining with them. This is most useful for helper functions that define both data and aesthetics and shouldn't inherit behaviour from the default plot specification, e.g.borders().- straight
A
logical(1)which ifTRUE, keeps the letters of a label on a straight baseline and ifFALSE(default), lets individual letters follow the curve. This might be helpful for noisy paths.- label.r
Radius of rounded corners. Defaults to 0.15 lines.
- label.padding
Amount of padding around label. Defaults to 0.25 lines.
- yintercept
The value at which the line should intercept the y axis
- xintercept
The value at which the line should intercept the y axis
Details
Although reference lines are straight, and therefore don't lend themselves to curved text, these geom layers are included in this package because they make labelling reference lines easier, allow automatic line breaking if desired, and will translate nicely into polar co-ordinates.
These geoms act slightly differently from other geoms. You can supply the
parameters in two ways: either as arguments to the layer function,
or via aesthetics. If you use arguments, e.g.
geom_textabline(label = "my label", intercept = 0, slope = 1), then behind
the scenes the geom makes a new data frame containing just the data you've
supplied. That means that the lines will be the same in all facets; if you
want them to vary across facets, construct the data frame yourself and use
aesthetics.
Unlike most other geoms, these geoms do not inherit aesthetics from the plot default, because they do not understand x and y aesthetics which are commonly set in the plot. They also do not affect the x and y scales.
Aesthetics
The geom_textabline(), geom_texthline() and geom_textvline() understand
the following aesthetics (required aesthetics are in bold):
labelslope(geom_textabline()andgeom_labelabline())intercept(geom_textabline()andgeom_labelabline())yintercept(geom_texthline()andgeom_labelhline())xintercept(geom_textvline()andgeom_labelvline())alphaanglecolourfamilyfontfacegrouphjustvjustlinecolourlineheightlinetypelinewidthsizespacingtextcolour
In addition to aforementioned aesthetics, geom_labelabline(),
geom_labelhline() and geom_labelvline() also understand:
boxcolourboxlinetypeboxlinewidthfill
The spacing aesthetic allows fine control of spacing of text, which is
called 'tracking' in typography. The default is 0 and units are measured in
1/1000 em. Numbers greater than zero increase the spacing, whereas negative
numbers decrease the spacing.
See also
Other geom layers that place text on paths.
Examples
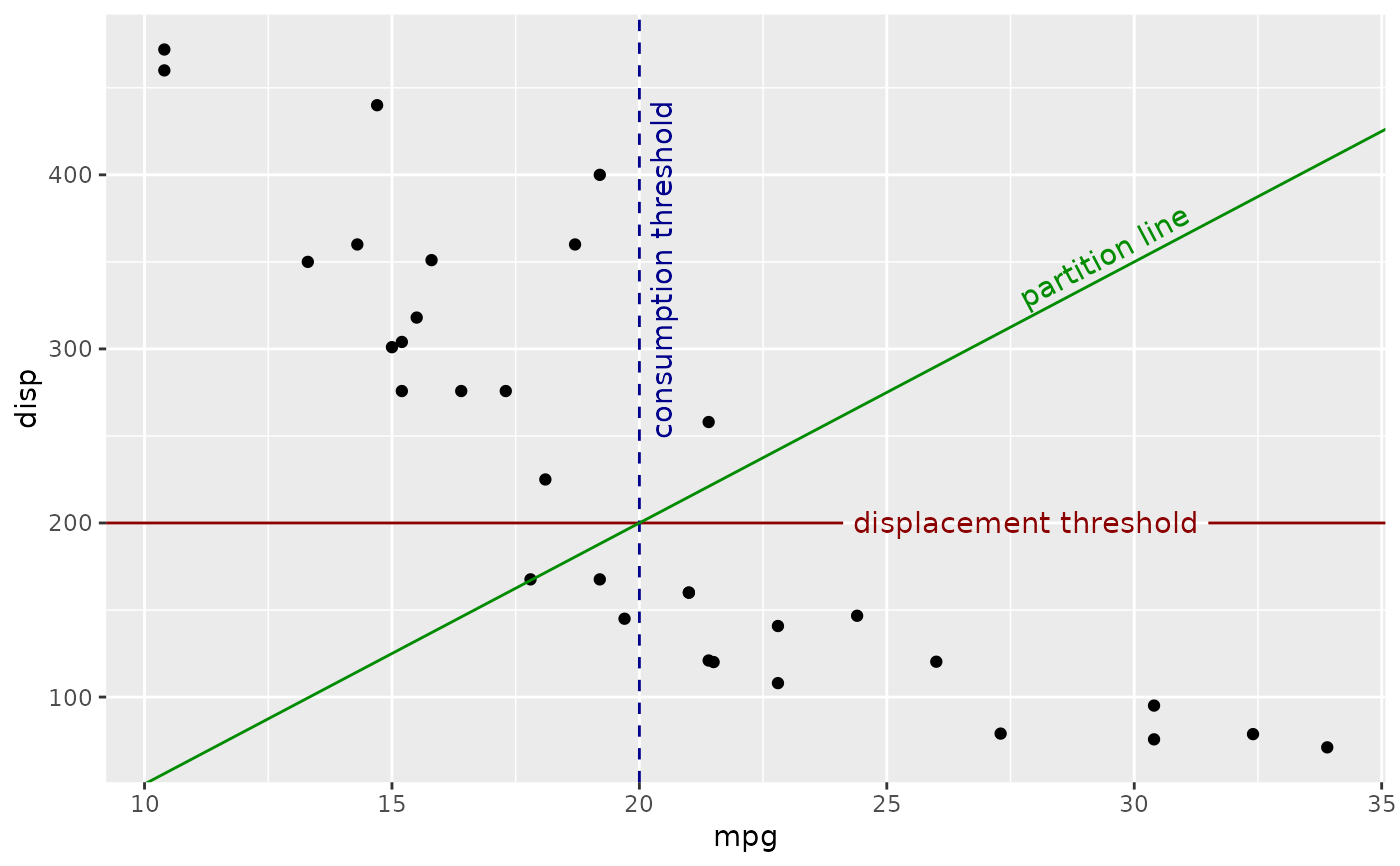
ggplot(mtcars, aes(mpg, disp)) +
geom_point() +
geom_texthline(yintercept = 200, label = "displacement threshold",
               hjust = 0.8, color = "red4") +
geom_textvline(xintercept = 20, label = "consumption threshold", hjust = 0.8,
               linetype = 2, vjust = 1.3, color = "blue4") +
geom_textabline(slope = 15, intercept = -100, label = "partition line",
                color = "green4", hjust = 0.6, vjust = -0.2)